Case study · decided file
The Committee Approves a Second Storey Over an Objection
341 Cosburn Ave · second-storey addition, objection at the hearing · approved 2022
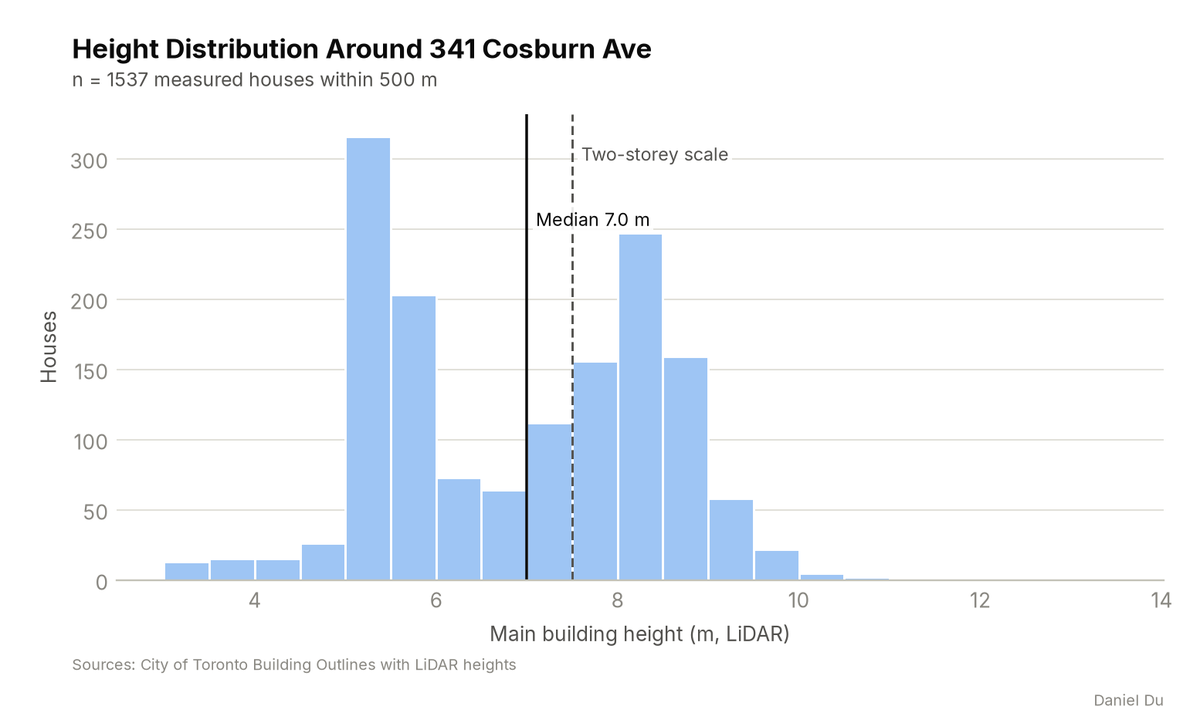
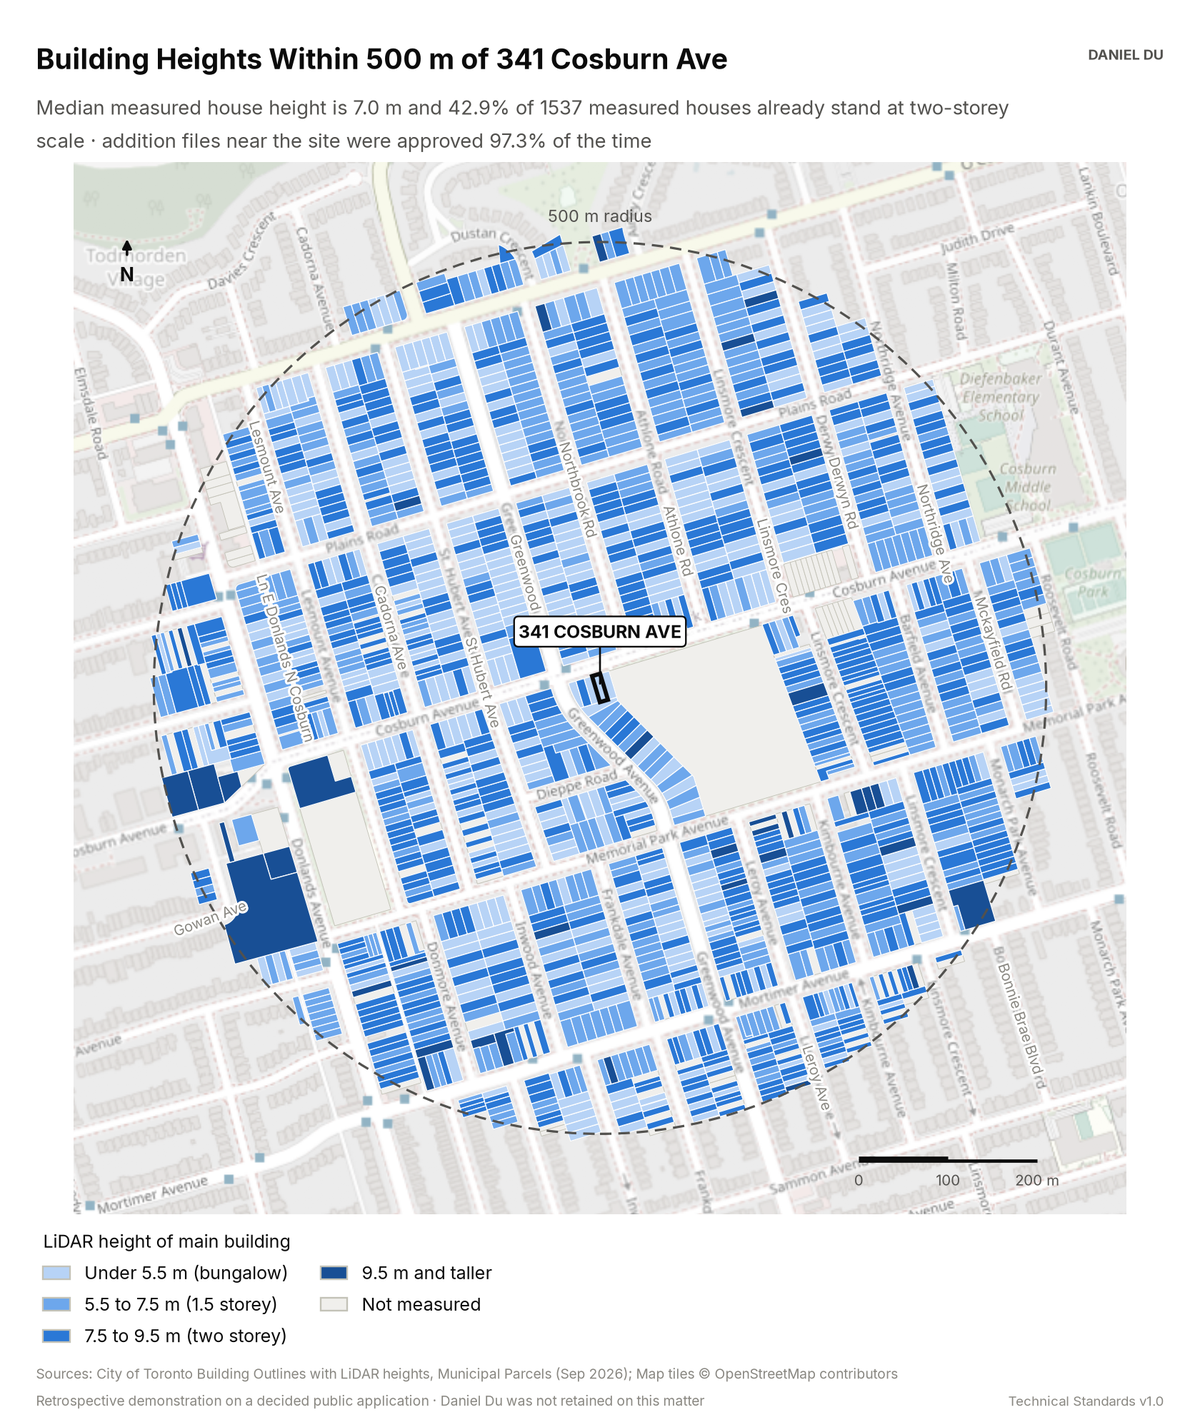
LiDAR rooflines show a pattern in transition. 42.9% of 1,537 measured houses stand at two-storey scale. Nearby addition files were approved 97.3% of the time.
This is a retrospective demonstration study. The Committee of Adjustment already decided this application, and the file is a public record. Daniel Du was not retained on the matter. We prepared this analysis after the decision, as a work sample. It states no planning opinion.
The package includes the report (PDF), print-ready map and chart exhibits (PNG), the full data table with a data dictionary (CSV), a methods note (TXT), the interactive map (HTML).
The interactive map is one HTML file. Open it from disk in any browser. Each threshold has a slider and an exact-value box, and the counts and headline update as you move them. You can change the colours, outlines and fill, switch to a colour gradient, or add a satellite, topographic or building footprint background. Click any mapped feature to see its record. The map works offline. The satellite and topographic backgrounds need an internet connection. The package also includes this same file.
How it is measured
Building heights are the City's LiDAR-derived values for the main building on each lot. We measure every lot within 500 m. The map bands the heights at the thresholds that matter in an 'out of character' argument. Addition precedent uses Committee of Adjustment records with the work type 'R Addition'. We geolocate each record to the parcel fabric. We normalize decisions. The record before 2015 is thin, so the counts are conservative.