Sample study · Neighbourhood character
Lot Area Pattern Study
The study measures every residential lot in the study radius. It compares each lot area to the by-law minimum.
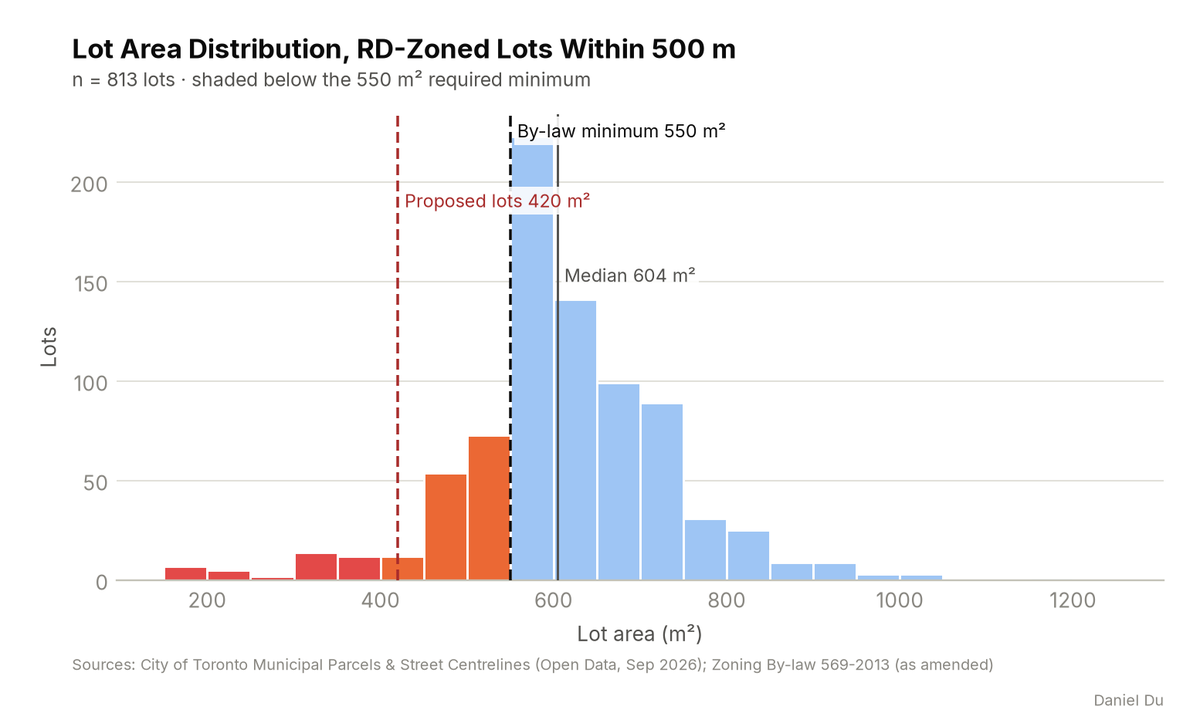
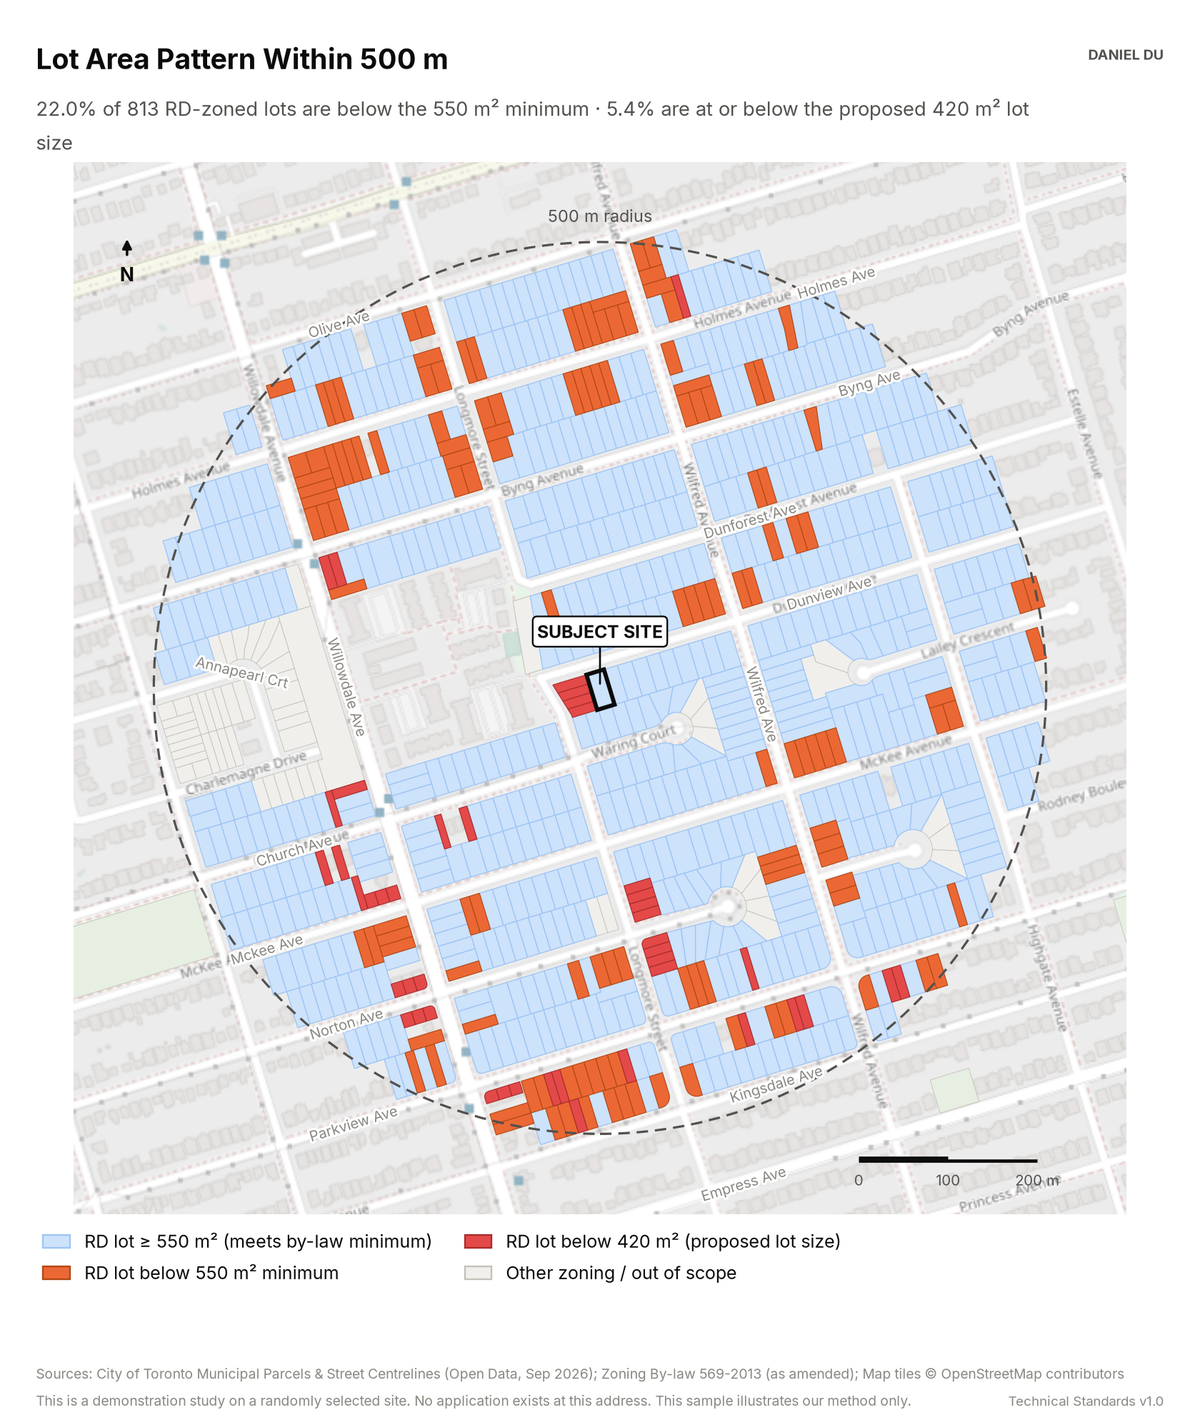
22.0% of 813 RD lots are below the 550 m² minimum
The package includes the report (PDF), print-ready map and chart exhibits (PNG), the full data table with a data dictionary (CSV), a methods note (TXT), the interactive map (HTML).
The interactive map is one HTML file. Open it from disk in any browser. Each threshold has a slider and an exact-value box, and the counts and headline update as you move them. You can change the colours, outlines and fill, switch to a colour gradient, or add a satellite, topographic or building footprint background. Click any shaded lot to see its measured values. The map works offline. The satellite and topographic backgrounds need an internet connection. The package also includes this same file.
How it is measured
Parcel geometry comes from the City of Toronto Municipal Parcels dataset. We exclude road parcels, rail corridor parcels and unaddressed slivers. This leaves addressed lots only. We assign each lot to its zoning polygon with a point-in-polygon test against the Zoning Area layer of Zoning By-law 569-2013. We score only lots in Residential Detached (RD) zones.
We compute lot area from the parcel geometry in MTM Zone 10 (EPSG:2952). This is the City's own projection. The areas are true metric values. We read the by-law minimum from the zone label on the Zoning By-law Map. This is the 'a' value in the label. For the zone of the subject site the value is 550 m².
We class each lot against two thresholds. The first is the by-law minimum. The second is the lot size that the demonstration scenario proposes. The map shades each class. The histogram shows the full distribution with both thresholds and the median marked. The CSV lists every lot with its address, zone, computed area and distance from the subject site.