Sample study · Neighbourhood character
Nonconformity Density Study
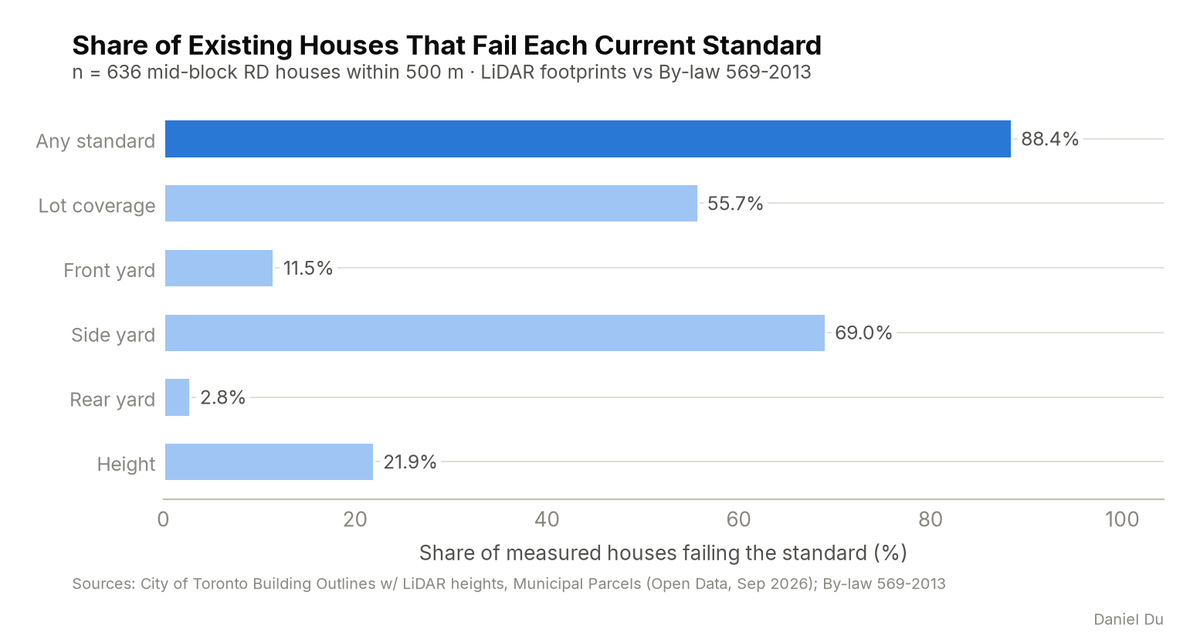
The study tests every existing house against the current coverage, height, and setback standards. This is the flagship number.
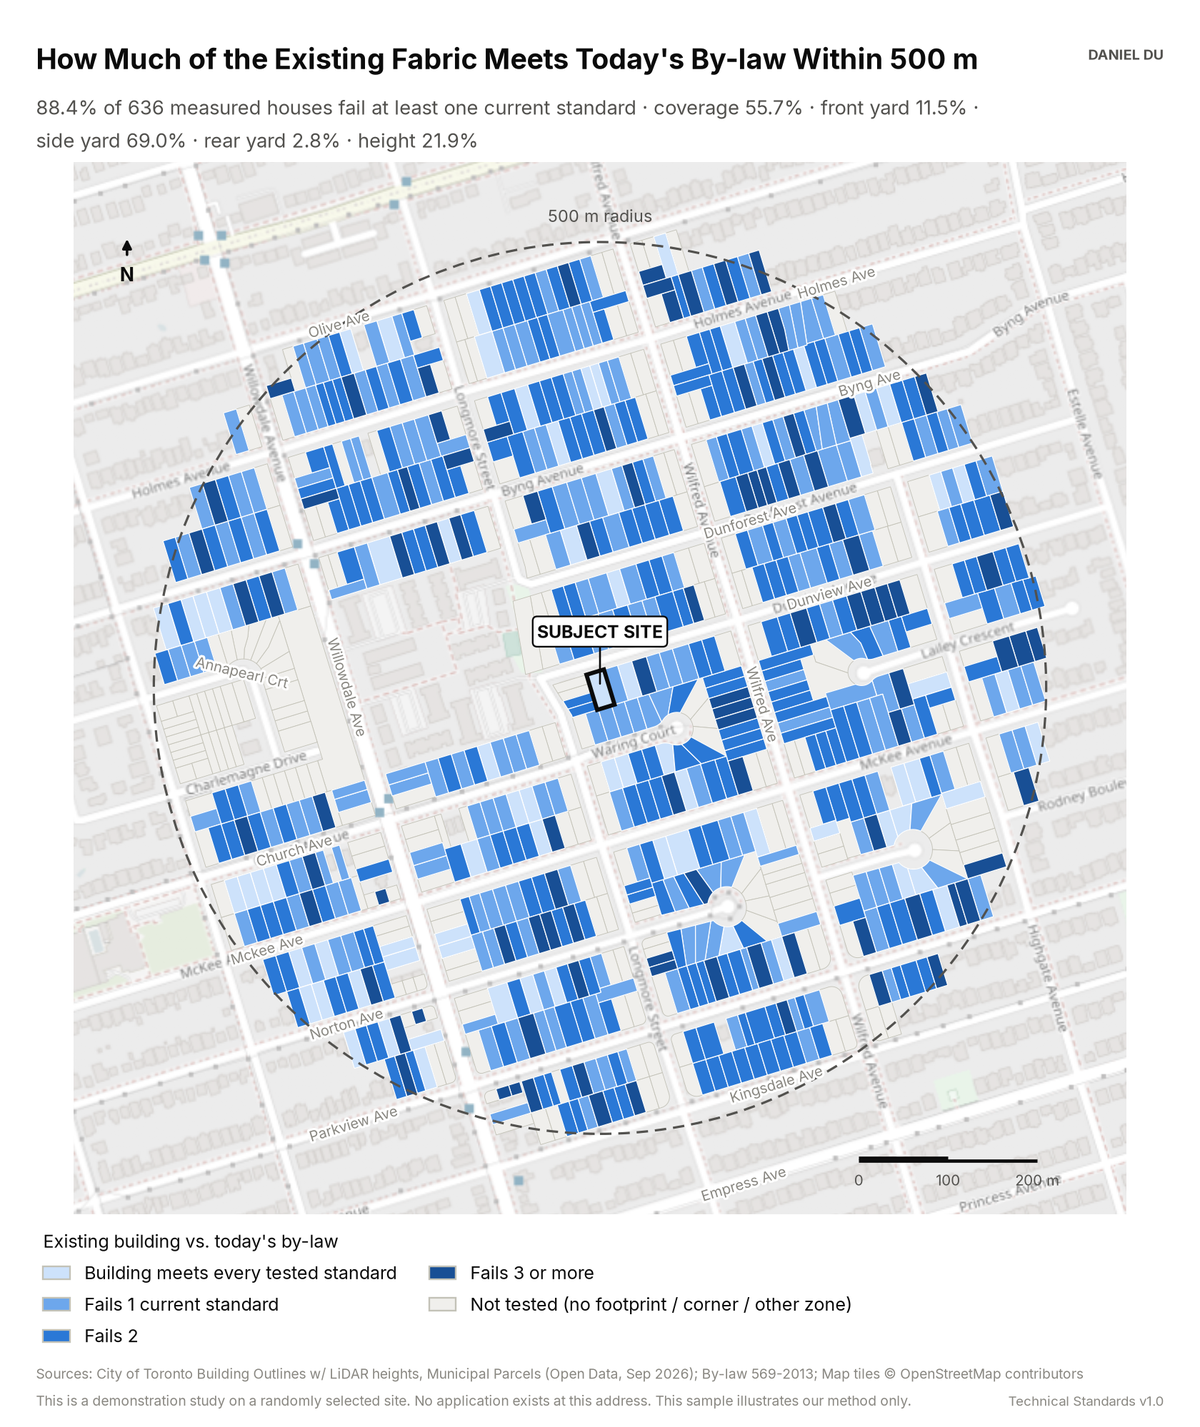
88.4% of measured houses fail at least one current standard
The package includes the report (PDF), print-ready map and chart exhibits (PNG), the full data table with a data dictionary (CSV), a methods note (TXT), the interactive map (HTML).
The interactive map is one HTML file. Open it from disk in any browser. Each threshold has a slider and an exact-value box, and the counts and headline update as you move them. You can change the colours, outlines and fill, switch to a colour gradient, or add a satellite, topographic or building footprint background. Click any shaded lot to see its measured values. The map works offline. The satellite and topographic backgrounds need an internet connection. The package also includes this same file.
The 2 km interactive map has the same controls and covers the full 2 km radius around the site.
How it is measured
Building footprints and LiDAR-derived heights come from the City's topographic building outlines. We measure the main building on each mid-block RD lot in a lot-aligned frame. Front, rear and side setbacks are the gaps between the footprint and the lot edges. Coverage is the sum of all footprints on the lot. Standards come from By-law 569-2013 as mapped. These are the Height and Lot Coverage overlays for each lot, the 6.0 m RD front yard, the 1.8 m side yard set by exception x5, and a rear yard of 7.5 m or 25% of lot depth, whichever is greater.
We subtract a measurement tolerance before we flag a lot. The tolerance is 0.1 to 0.5 m for setbacks and height, and 0.5 percentage points for coverage. Every reported failure is therefore larger than the digitization error. We exclude corner lots and lots without a usable footprint. The map shows excluded lots unshaded.
Footprint measurement reads the building at grade. Porches and bay windows within permitted encroachments can therefore register as smaller setbacks. The tolerance absorbs most of this effect. The per-lot table allows a check of any specific lot.