Sample study · Neighbourhood character
As-Built Height Study
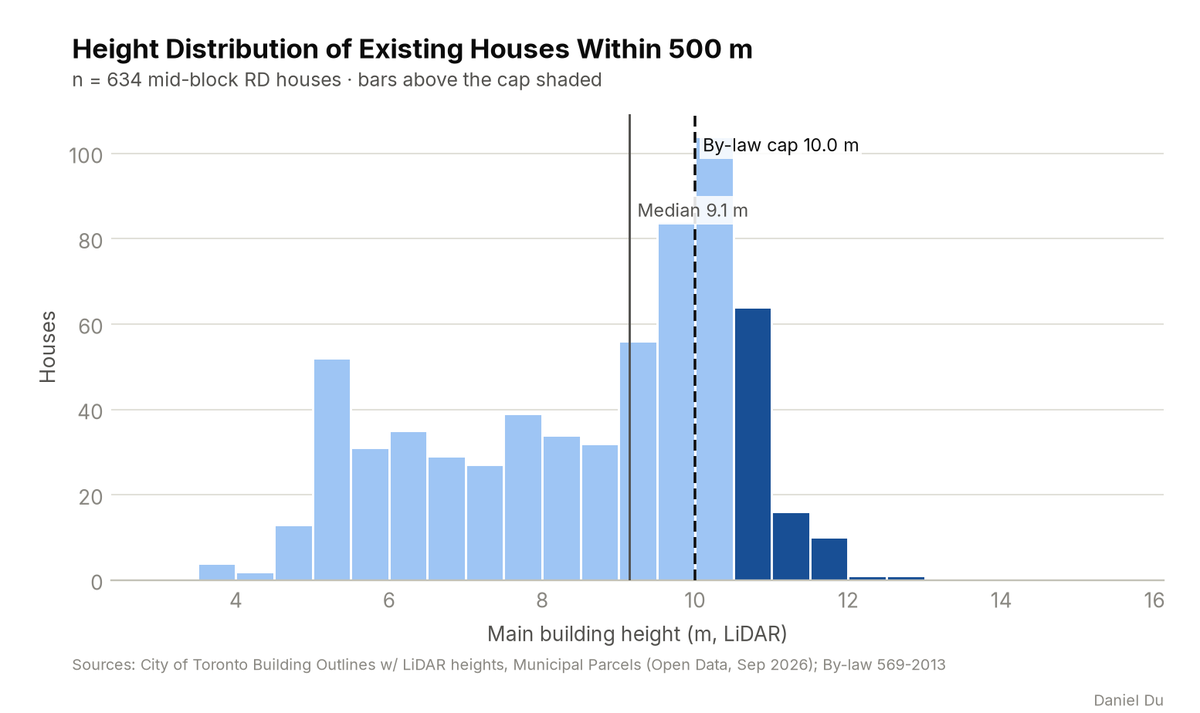
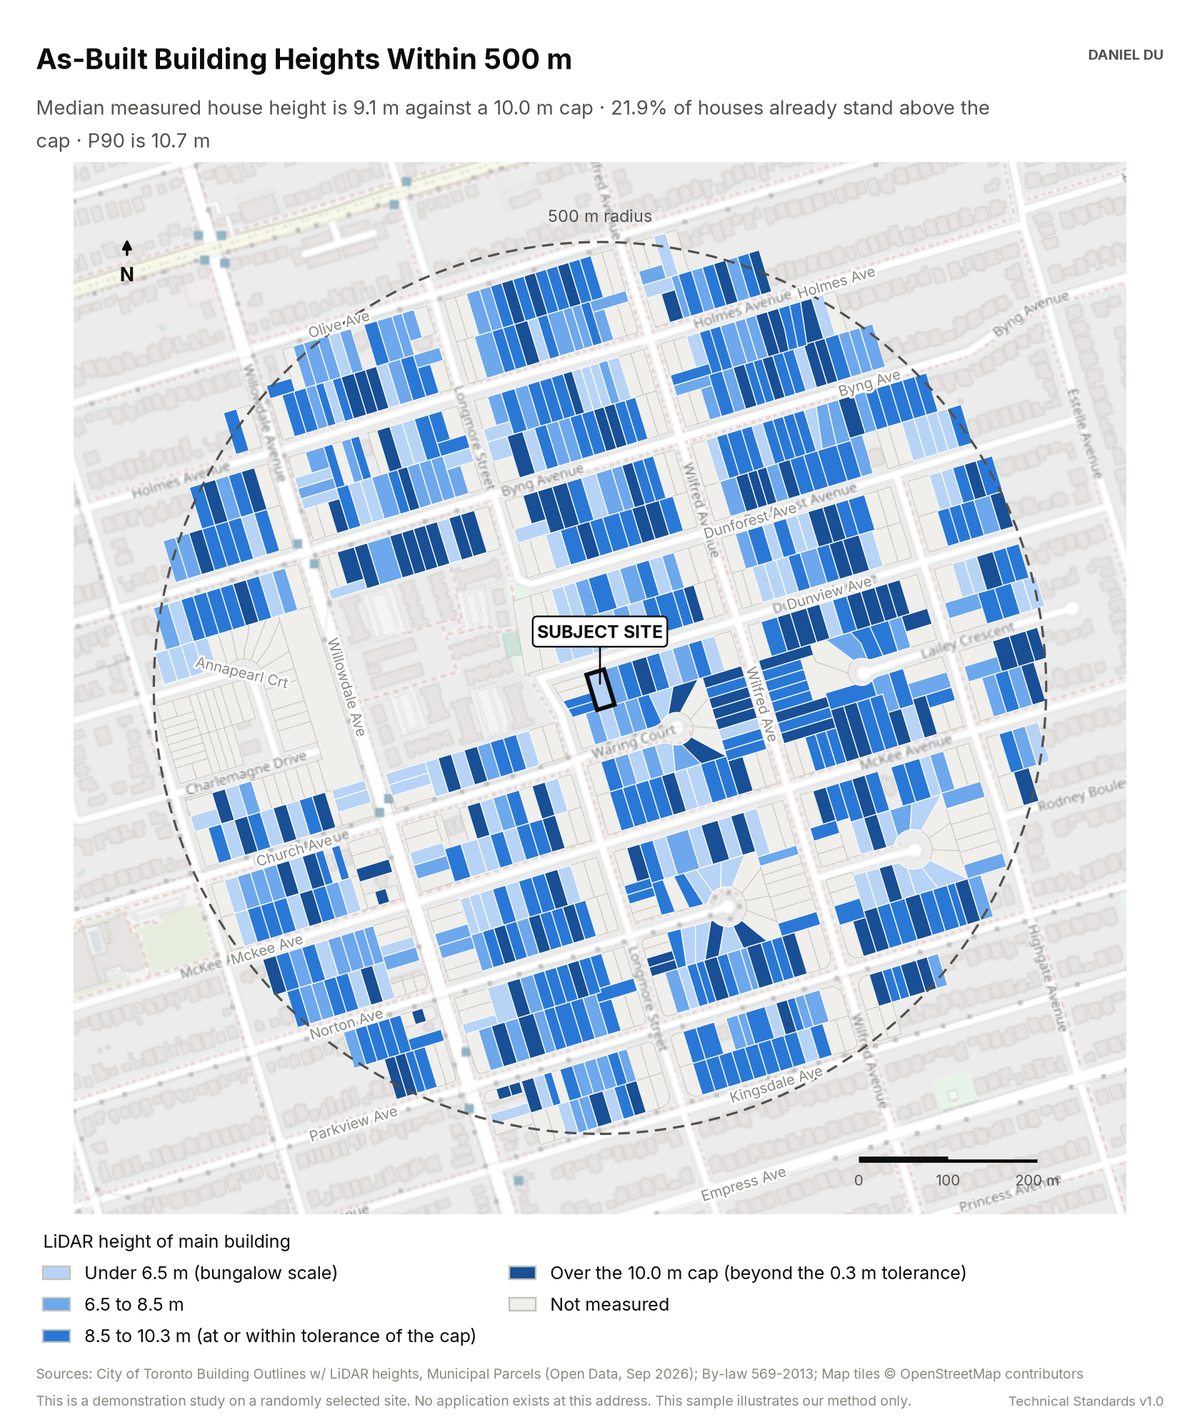
The study measures the roofline of every house in the radius. It compares each height to the mapped height cap.
21.9% of houses already stand above the 10.0 m cap
The package includes the report (PDF), print-ready map and chart exhibits (PNG), the full data table with a data dictionary (CSV), a methods note (TXT), the interactive map (HTML).
The interactive map is one HTML file. Open it from disk in any browser. Each threshold has a slider and an exact-value box, and the counts and headline update as you move them. You can change the colours, outlines and fill, switch to a colour gradient, or add a satellite, topographic or building footprint background. Click any shaded lot to see its measured values. The map works offline. The satellite and topographic backgrounds need an internet connection. The package also includes this same file.
The 2 km interactive map has the same controls and covers the full 2 km radius around the site.
How it is measured
Heights are the City's LiDAR-derived value for each building outline. We take the value for the main building on each mid-block RD lot. The cap is the Height Overlay value mapped at each lot (HT 10.0 across this radius). We subtract a 0.3 m tolerance before we count a house as over the cap. LiDAR reads the highest roof element, which can include chimneys. The tolerance and the per-lot table keep that limitation open to inspection.