Sample study · Neighbourhood character
Front Yard Setback & Averaging Study
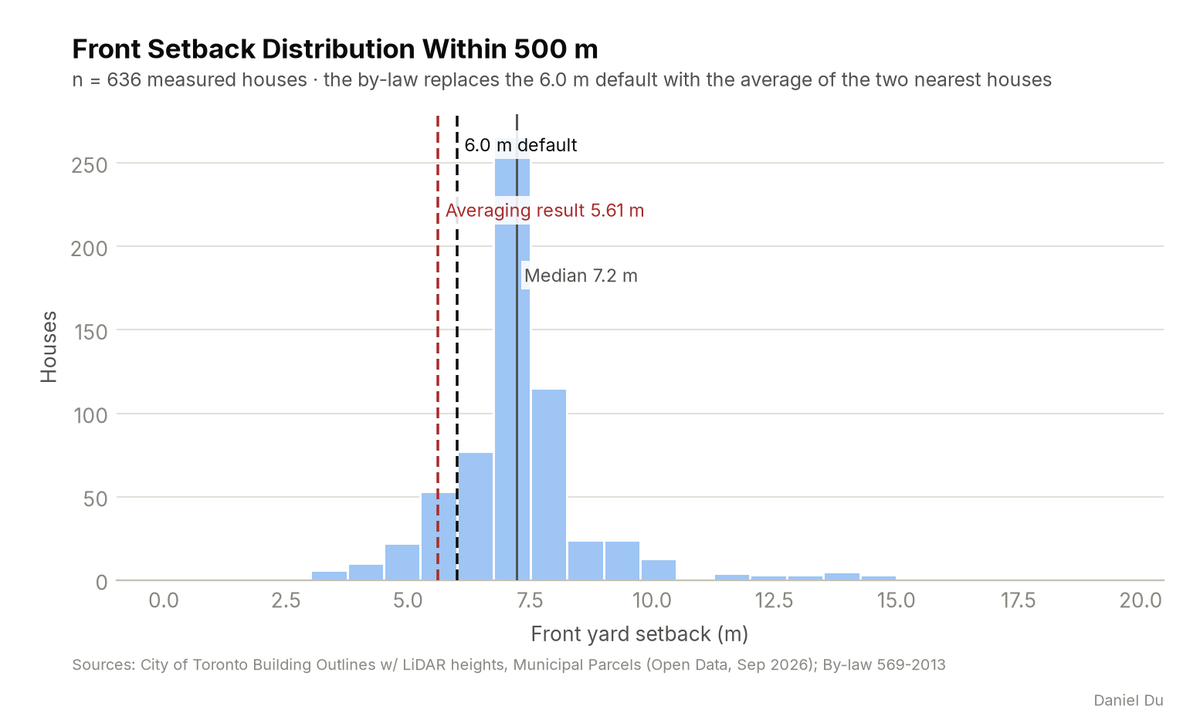
The study computes the statutory setback average with exact precision. It also shows the full setback distribution.
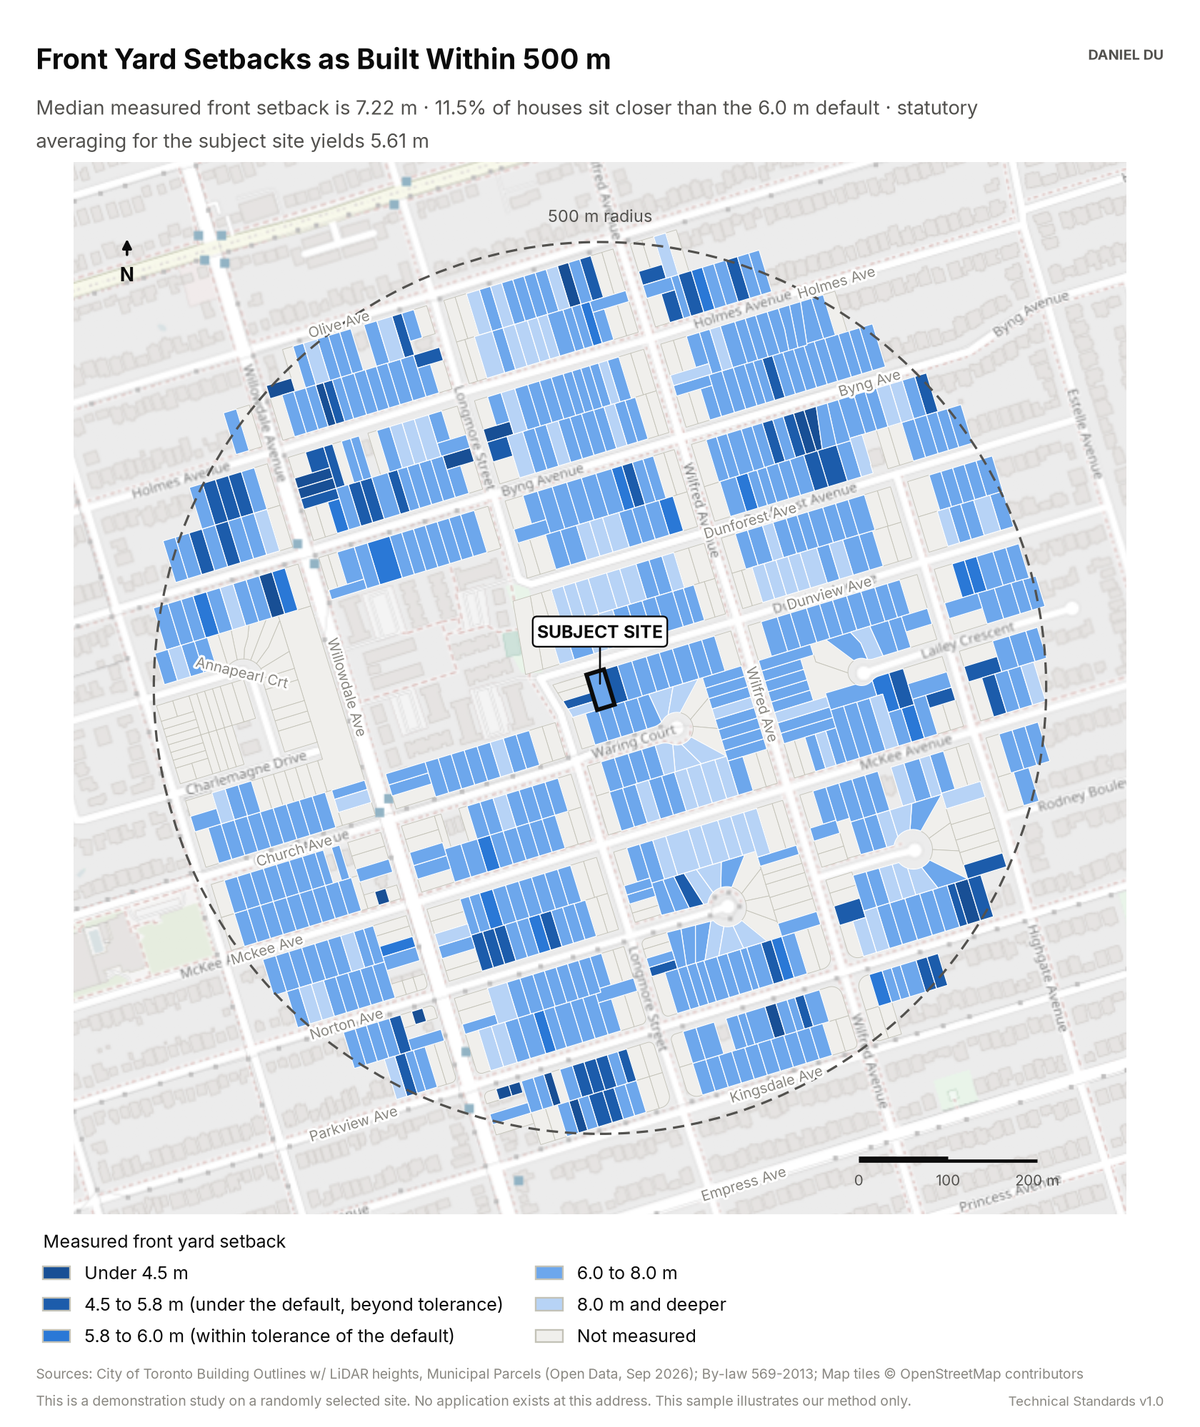
Averaging for the demo site: 5.61 m against a 6.0 m default
The package includes the report (PDF), print-ready map and chart exhibits (PNG), the full data table with a data dictionary (CSV), a methods note (TXT), the interactive map (HTML).
The interactive map is one HTML file. Open it from disk in any browser. Each threshold has a slider and an exact-value box, and the counts and headline update as you move them. You can change the colours, outlines and fill, switch to a colour gradient, or add a satellite, topographic or building footprint background. Click any shaded lot to see its measured values. The map works offline. The satellite and topographic backgrounds need an internet connection. The package also includes this same file.
The 2 km interactive map has the same controls and covers the full 2 km radius around the site.
How it is measured
Front setback is the gap between the main building's footprint and the street-facing edge of the lot. We measure it in a lot-aligned frame from LiDAR building outlines. The statutory averaging follows regulation 10.5.40.70(1). We take the two nearest buildings on the same street, each within 60 m, and average their setbacks. Porches within permitted encroachments can read as smaller setbacks at grade. The per-lot table lets any figure be checked against a survey.