Sample study · Neighbourhood change
Permit Intensity Study
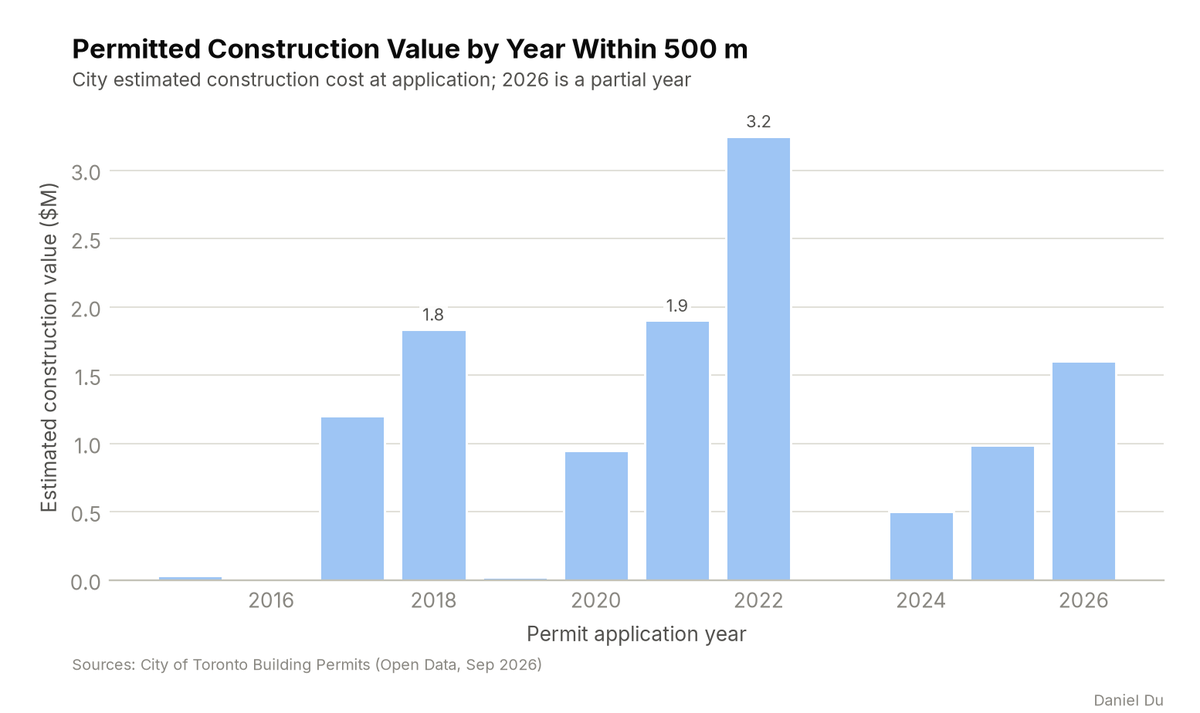
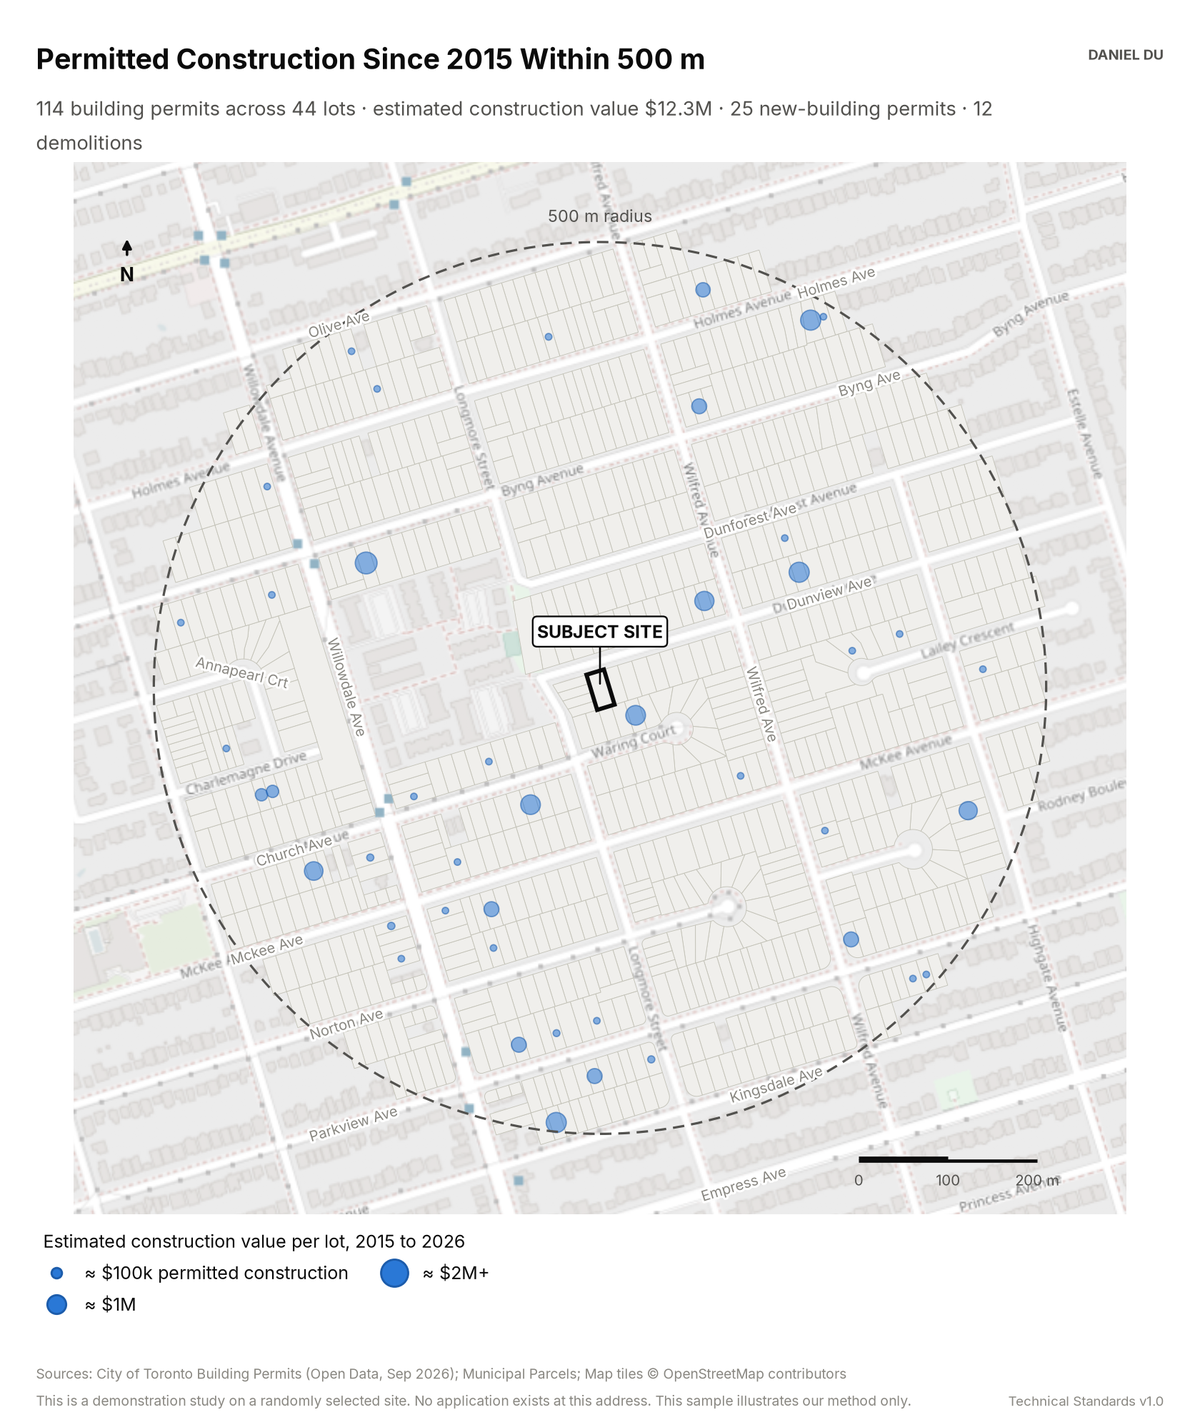
The study shows the permitted construction value for each lot since 2015. Use it to answer the stability objection with money.
Result on 205 Dunview Ave, Willowdale
$12.3M permitted within 500 m since 2015
The package includes the report (PDF), print-ready map and chart exhibits (PNG), the full data table with a data dictionary (CSV), a methods note (TXT).
How it is measured
We match building permit records by address to the parcel fabric. We keep the permits within the 500 m radius. The analysis covers permits applied for since 2015. Value is the City's estimated construction cost at the time of application. We total the value per lot for the map and per year for the chart. Estimated cost is lower than final spend. The totals are therefore conservative.