Case study · decided file
The Committee Refuses Three Lots on Craven Road
291 Craven Rd · consent to sever into three lots · refused 2018 · tribunal upheld the refusal
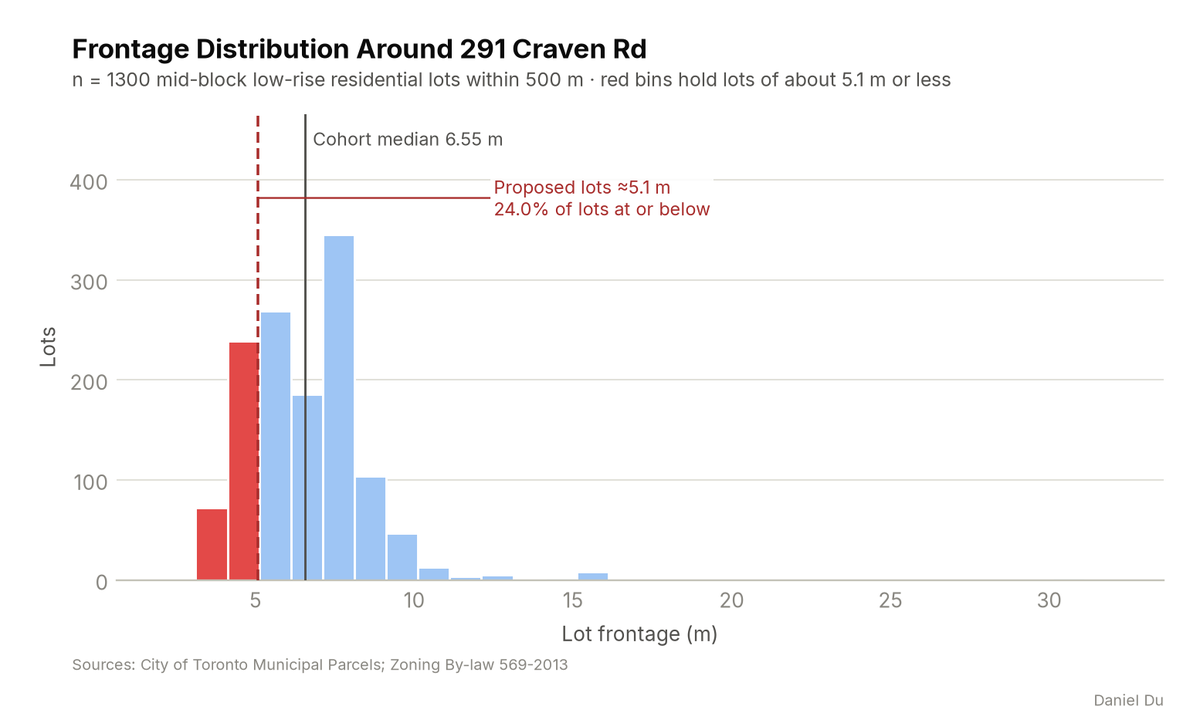
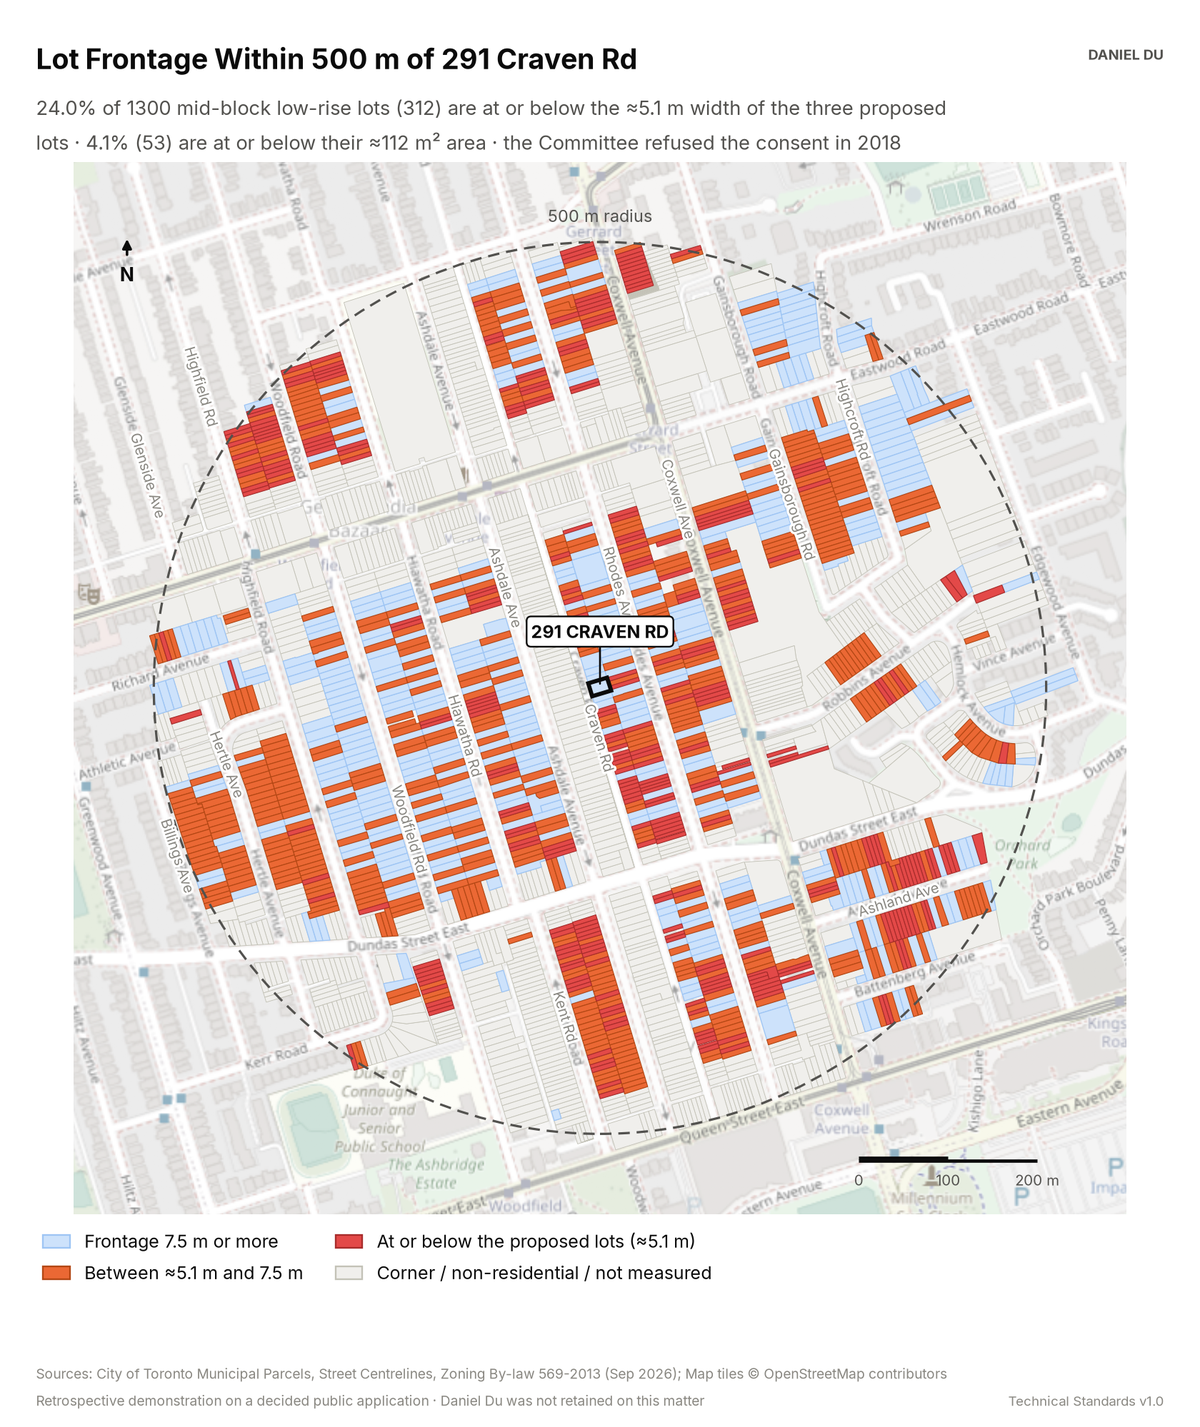
The proposed frontage was close to the 5.43 m median on Craven Road. Across the 500 m study area, only 4.1% of lots are at or below the proposed 112 m².
This is a retrospective demonstration study. The Committee of Adjustment already decided this application, and the file is a public record. Daniel Du was not retained on the matter. We prepared this analysis after the decision, as a work sample. It states no planning opinion.
The package includes the report (PDF), print-ready map and chart exhibits (PNG), the data tables with a data dictionary (CSV), a methods note (TXT), the interactive map (HTML).
The interactive map is one HTML file. Open it from disk in any browser. Each threshold has a slider and an exact-value box, and the counts and headline update as you move them. You can change the colours, outlines and fill, switch to a colour gradient, or add a satellite, topographic or building footprint background. Click any mapped feature to see its record. The map works offline. The satellite and topographic backgrounds need an internet connection. The package also includes this same file.
How it is measured
We measure every low-rise residential lot within 500 m from parcel geometry in EPSG:2952. Frontage is the street-facing edge of the lot, projected along the street. Area is the parcel polygon area. We exclude corner lots from the statistics. We report the share of lots at or below the proposed width and area as a percentile rank. A lot counts as at or below when it is within 0.05 m of the proposed width or within 0.5 m² of the proposed area.
We estimate the width and area of each proposed lot as one third of the measured subject parcel. The decision record describes 'three undersized residential lots' but does not publish the certified dimensions of the refused parts. We state this approximation openly. If the parts were unequal, the smallest part sat further into the tail than these figures show.
Where a lot's own zone label carries an 'f' value, we compare the lot with that value. The same method was used in the delivered Windermere study. The plain R (d0.6) label carries no 'f' value, so most lots in this area cannot be tested this way. We report the tested subset only.
Consent precedent comes from Committee of Adjustment records. We geolocate each record to the parcel fabric and keep files received in 2015 or later. We separate technical severances, which re-establish lots that merged on title, from consents that propose new lots. The open record is thin before 2015, so the precedent counts are conservative. The decision record does not publish the Committee's reasons, and this study does not infer them.