Sample study · Neighbourhood character
Lot Depth & Shape Study
The study measures the depth, corner status, and shape of every lot. Use it to test claims about 'abnormal' lots.
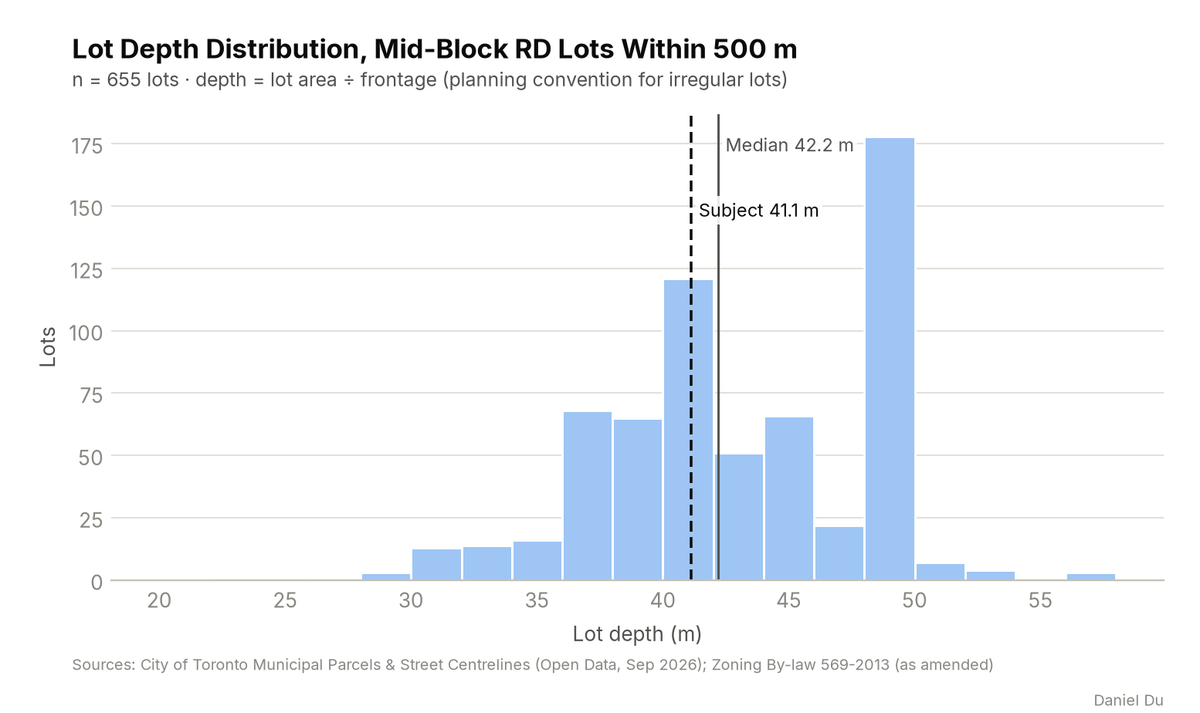
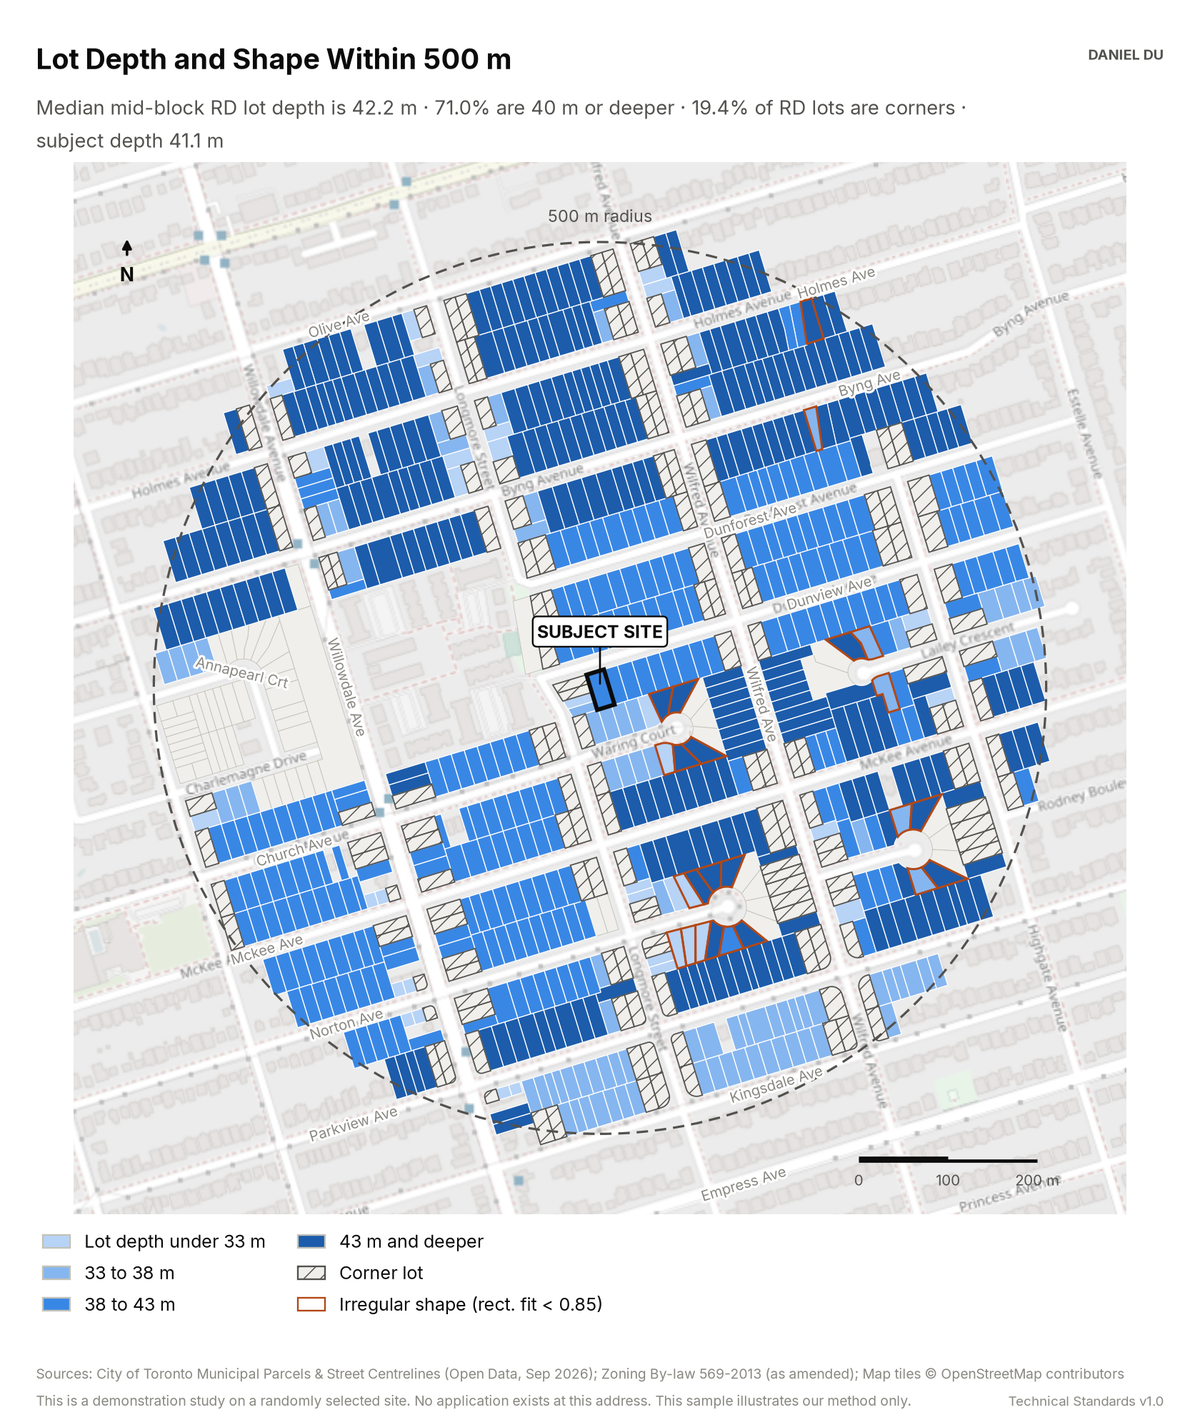
Median lot depth 42.2 m; 19.4% of lots are corners
The package includes the report (PDF), print-ready map and chart exhibits (PNG), the full data table with a data dictionary (CSV), a methods note (TXT).
The 2 km interactive map has the same controls and covers the full 2 km radius around the site.
How it is measured
We compute depth as lot area divided by street frontage. This is the planning convention and it stays meaningful for irregular lots. We measure both inputs from parcel geometry in EPSG:2952. Shape regularity is the ratio of lot area to the area of the minimum rotated rectangle around the lot. A perfect rectangle scores 1.0. The study flags lots below 0.85 as irregular.
We detect corner status geometrically. A lot that fronts two street centrelines with different names is a corner lot. The map classes mid-block lots by depth band. It hatches corner lots and outlines irregular lots. The CSV carries every metric for every lot.