Sample study · The decision record
Objection Geography Study
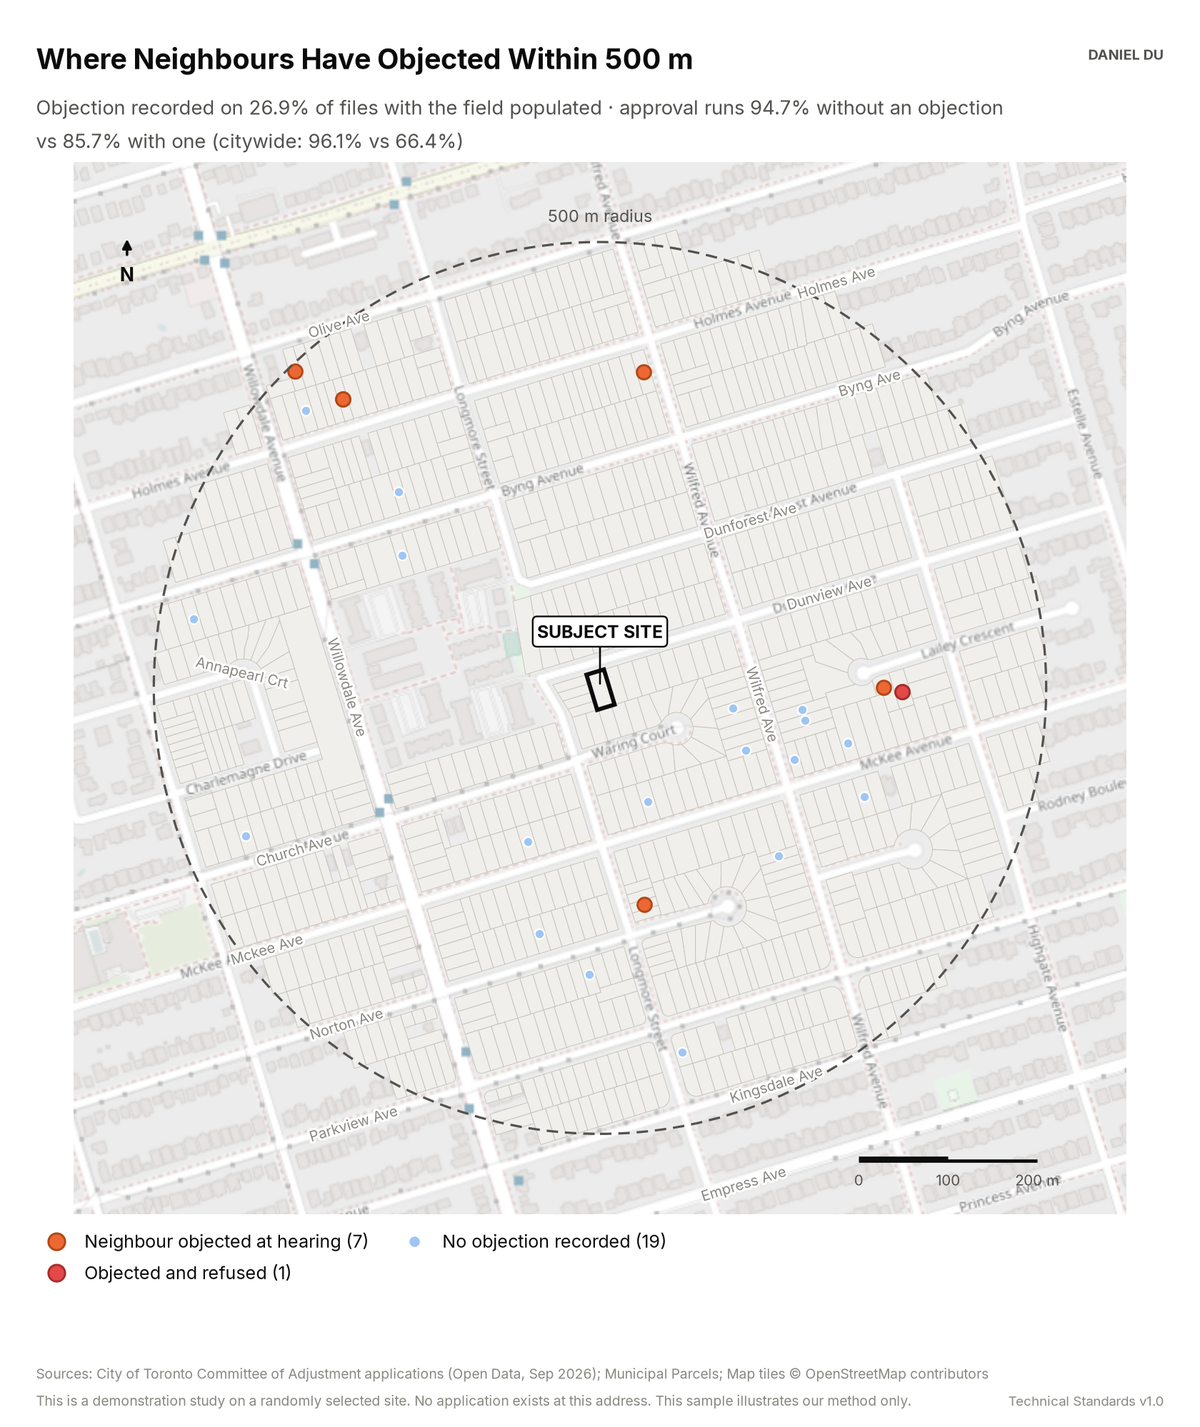
The study maps where neighbours objected. It shows the effect of an objection on the approval rate.
Citywide: approval falls from 96.1% to 66.4% when someone objects
The package includes the report (PDF), the print-ready map exhibit (PNG), the full data table with a data dictionary (CSV), a methods note (TXT).
The 2 km interactive map has the same controls and covers the full 2 km radius around the site.
How it is measured
The objection flag is the 'anyone object at meeting' field. The City records this field for each Committee of Adjustment file. We map the files within 500 m where the field is populated, each at its own lot. Files with an objection appear as large orange markers. Files with an objection and a refusal appear in red. Files with no objection appear as small blue markers. Approval rates use normalized decisions. An approval with conditions counts as an approval. We report the rates for the radius and for the city.
The field covers only part of the record. The study states the coverage and the selection effect plainly. This keeps the statistic usable in front of a panel.