Sample study · The decision record
Variance & Consent Precedent Study
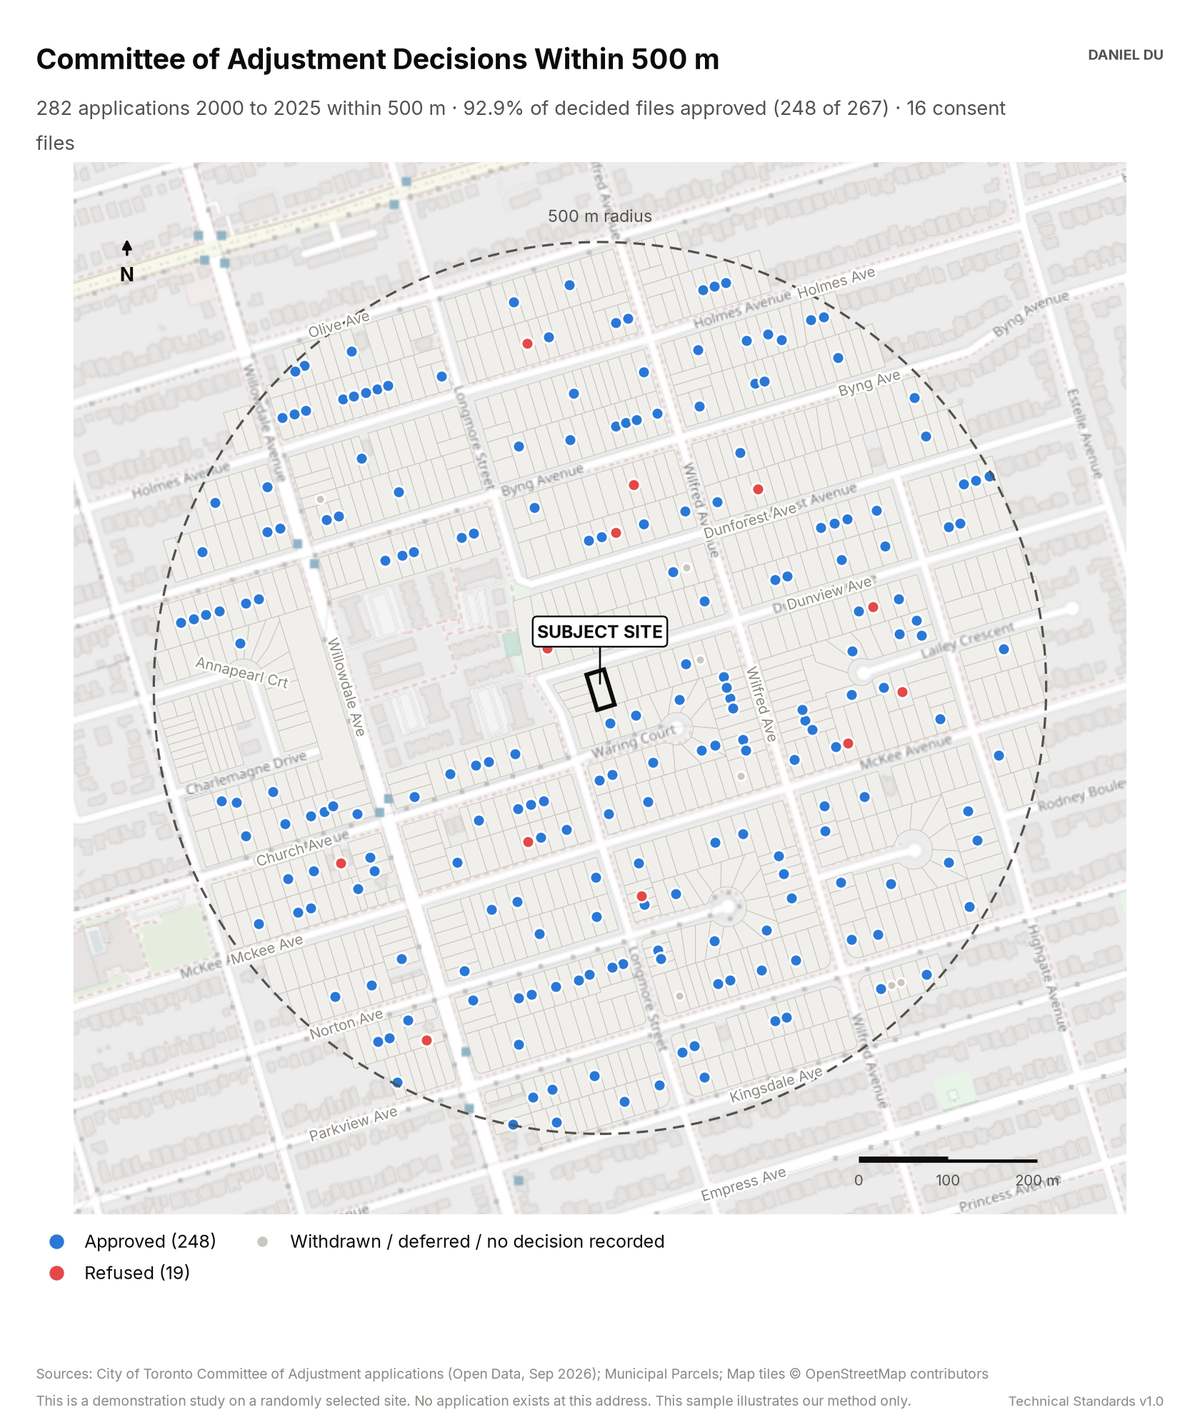
The study maps every Committee of Adjustment application in the radius. It lists the outcome of each application for citation.
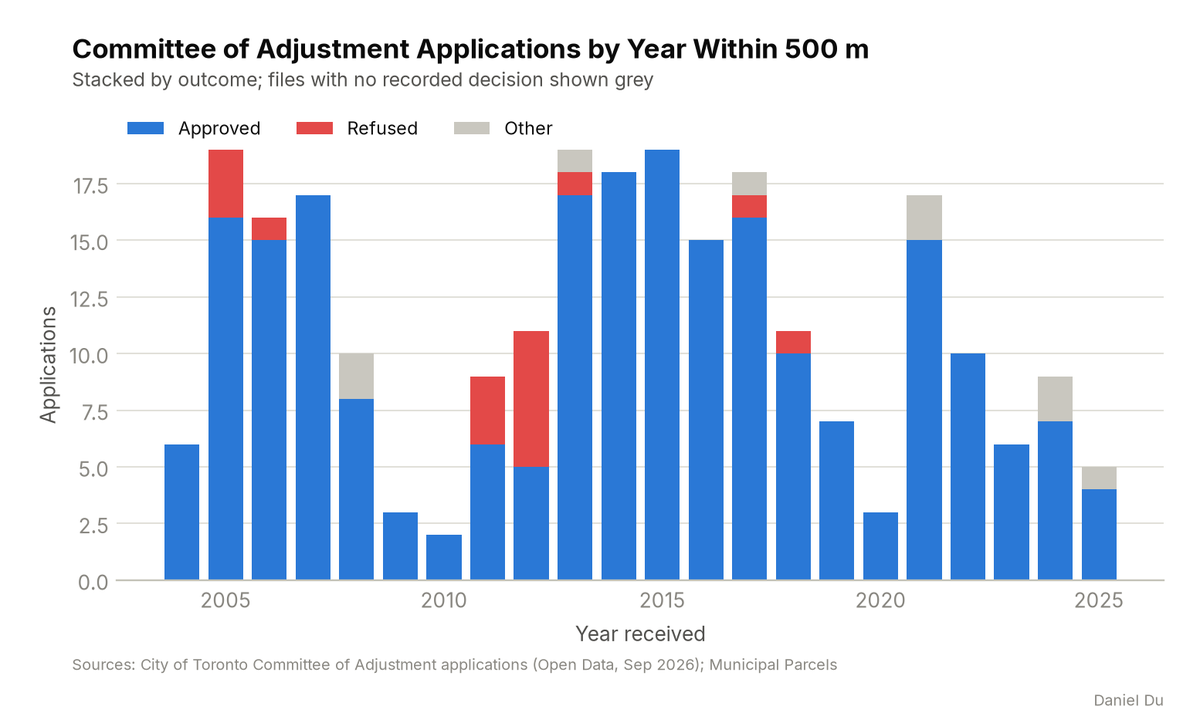
282 applications since 2000; 92.9% of decided files approved
The package includes the report (PDF), print-ready map and chart exhibits (PNG), the full data table with a data dictionary (CSV), a methods note (TXT), the interactive map (HTML).
The interactive map is one HTML file. Open it from disk in any browser. Each threshold has a slider and an exact-value box, and the counts and headline update as you move them. You can change the colours, outlines and fill, switch to a colour gradient, or add a satellite, topographic or building footprint background. Click any shaded lot to see its measured values. The map works offline. The satellite and topographic backgrounds need an internet connection. The package also includes this same file.
The 2 km interactive map has the same controls and covers the full 2 km radius around the site.
How it is measured
We take Committee of Adjustment records from the City's open dataset of applications. We geolocate each file by matching its address to the parcel fabric. We keep the files within the 500 m radius. We normalize the decisions. An approval with conditions counts as an approval. Files with no recorded decision are shown on the map but excluded from the approval rate. Most of these files were withdrawn, deferred, or have data gaps.
The open dataset does not record the size of each variance. That information exists only as prose in the description of each file. The CSV includes the description. A reader can identify comparable relief by reading the text instead of guessing.